
Motivation
One of the most common challenges that you will face in your career, or even in your life, is to choose one thing over another. It could be a decision between going out to eat at a sushi place and a pizzeria, or it could be between a 2-month-long software project that costs $1M and a 10-day-long project that costs $10K. The fact is: we spend a long time deciding the best path.
 source: xkcd
What is cost of delay
Cost of Delay (CoD) is the economic impact of a project’s delay. In other words, it is how much you will fail to make if the product, or feature, is not ready on a certain date. The benefit of using it is to be able to make more-informed and better decisions because you’re taking into account the economic impact.
How to calculate cost of delay
To calculate CoD you can just estimate how much profit is expected from the software project’s result after a period of time.
Let’s say you expect that the software product you are developing, once finished, will give the company a return of US$ 10,000 per week. In that context, the cost of delay is US$ 10,000/week. In other words, for every week that the project is delayed, the company would be losing US$ 10,000. Not that good, uh?
Another metric related to cost of delay is CD3 (Cost of Delay Divided by Duration). The difference between both is that in CD3, we divide CoD by the duration of the project. That can be a good metric for prioritization. Here’s how to calculate it:
- Calculate the expected project’s weekly profit (CoD);
- Calculate, approximately, how much time it would take to implement it;
- Divide the profit by the estimated project duration;
The higher the CD3 value is, more important it is, since the return on the investment will be faster.
Types of cost of delay
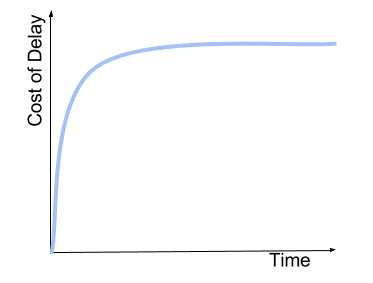
Standard Curve

In standard curves, the CoD of the project grows almost linearly with time. This is the simplest CoD to calculate, since it does not change with time.
Urgent Curve
In urgent curves the project needs to be delivered really fast in order to generate value to the company, otherwise a lot is lost. This happens, for example, when you know of a competitor’s big launch and there is not much time to react and compete in the market. The CoD will probably be extremely high starting on the deadline week and increase just a little over time.
Fixed date curve

Fixed date curve is the classic example of a project in which the deadline is immutable. In this case, the CoD is highly linked to a specific date. The urgent curve example is also valid here if you know of a competitor’s launch beforehand. Another example is when there is a national TV advertisement scheduled for a certain date, or even the implementation of new legislation that will affect the project. In this case, the CoD calculation will be a little bit more complex. In the first weeks the CoD will be growing at a moderate rate, however, after a certain week, the cost receives a huge increase, and after that, it returns to have a small growth rate.
Intangible curve

The intangible curve covers those projects that have a low CoD. In this case, the projects usually have low priority inside the company, because they cause little or no impact on its results. The CoD in these cases is almost static, since there is not enough risk on delaying the project.
How to use it
Besides the obvious outcome of using CoD, that is the knowledge of how much you will lose weekly if the project gets delayed, it is possible to use it as a decision-making tool to prioritize projects.
Example
Let’s say you have two software projects: A and B. Both with standard-curve CoDs.
| Project | Weekly Profit | Predicted Duration |
|---|---|---|
| A | $10,000 | 72 weeks |
| B | $400 | 2 weeks |
One may think, based on the projects’ details, that project A is more important than project B. However, if you calculate the CD3, you will see that CD3_A = 138.8 while CD3_B = 200.
But what does that mean? It means that if you work on software B first, you will anticipate revenue generation when compared to starting with software A. Don’t believe it yet? Here is a 75-week simulation:
| Week Number | Revenue if A is Finished First | Revenue if B is Finished first |
|---|---|---|
| 1 | $0 – Start project A | $0 – Start project B |
| 2 | $0 | $0 – Finish project B |
| 3 | $0 | $400 – Start project A |
| 30 | $0 | $11,200 |
| 72 | $0 – Finish project A | $28,000 |
| 73 | $10,000 – Start project B | $28,400 |
| 74 | $20,000 – Finish project B | $28,800 – Finish project A |
| 75 | $30,400 | $39,200 |
Attention Point
It is important to notice that the CoD curve that a project follows may change with time. To illustrate that, let’s say that a software that will bring a never-seen-before product to the market is running. Since there is no competition, it follows a standard curve. However, after a year of development, some news arrives and the team discovers that a competitor is now developing something with the same features, and will launch it on day X. From now on, the project’s curve will probably follow the fixed-date, with the steep line being on day X.
Conclusion
You can, and should, use CoD every time you are in doubt on how to prioritize two or more projects. It is an easy to calculate method and, by thinking about all those details, it may give you even more insights about the projects.
If you discover that you need to launch your product sooner, after calculating the CoD, and you don’t have enough time or people, contact us to learn more about how we’ve been helping our clients on developing high-quality custom software, written in either Elixir or Ruby, and what we can do for you.
What about you? What do you think about using cost of delay to help you prioritize projects? Leave your comments below!

I worked at Plataformatec some years ago and I remember that besides delivering great software, we were also taking bigger and bigger responsibilities when helping clients to make better business and product decisions (in the scope of projects and features priorities).
Is this approach somehow related to opportunity cost? https://en.wikipedia.org/wiki/Opportunity_cost
Hey nice hearing from you!
So, opportunity cost (OC) is indeed related to cost of delay (CoD), actually, CoD is the quantification of the opportunity cost. 🙂
But let me go a little bit further here… from the http://www.businessdictionary.com/definition/opportunity-cost.html , we have that “every action, choice, or decision has an associated opportunity cost”
Therefore CoD and OC will not always converge.
Imagine that you have a delayed project that will surpass a deadline. In this case, the CoD will not be exactly a quantification of the OC, because you do not have a choice, it is only a quantification of your delay (as the name already suggests it), not an opportunity. It is a fact.
But when we have to choose between two projects, like in the blog post’s example, both CoD and OC will converge.
Is it clearer now? I hope it helped 🙂
Approv