It’s common that our first experience with debugging in a new language is by printing values to the terminal. Elixir isn’t different: we can use IO.puts/2 and IO.inspect/2. However, Elixir also provides other approaches to debugging.
In this blog post, we’ll show you other 2 options: IEx.pry/0 and :debugger.
IEx.pry
The name “pry” is an old friend in the Ruby ecosystem but it has a different behavior in Elixir. Let’s create a new project with mix to try it out:
$ mix new example
$ cd example
Now let’s write some sample code in lib/example.ex:
require IEx;

defmodule Example do
  def double_sum(x, y) do
    IEx.pry
    hard_work(x, y)
  end

  defp hard_work(x, y) do
    2 * (x + y)
  end
end
Now start a new IEx session and invoke our new function:
$ iex -S mix
Interactive Elixir (1.2.4) - press Ctrl+C to exit (type h() ENTER for help)
iex(1)> Example.double_sum(1, 2)
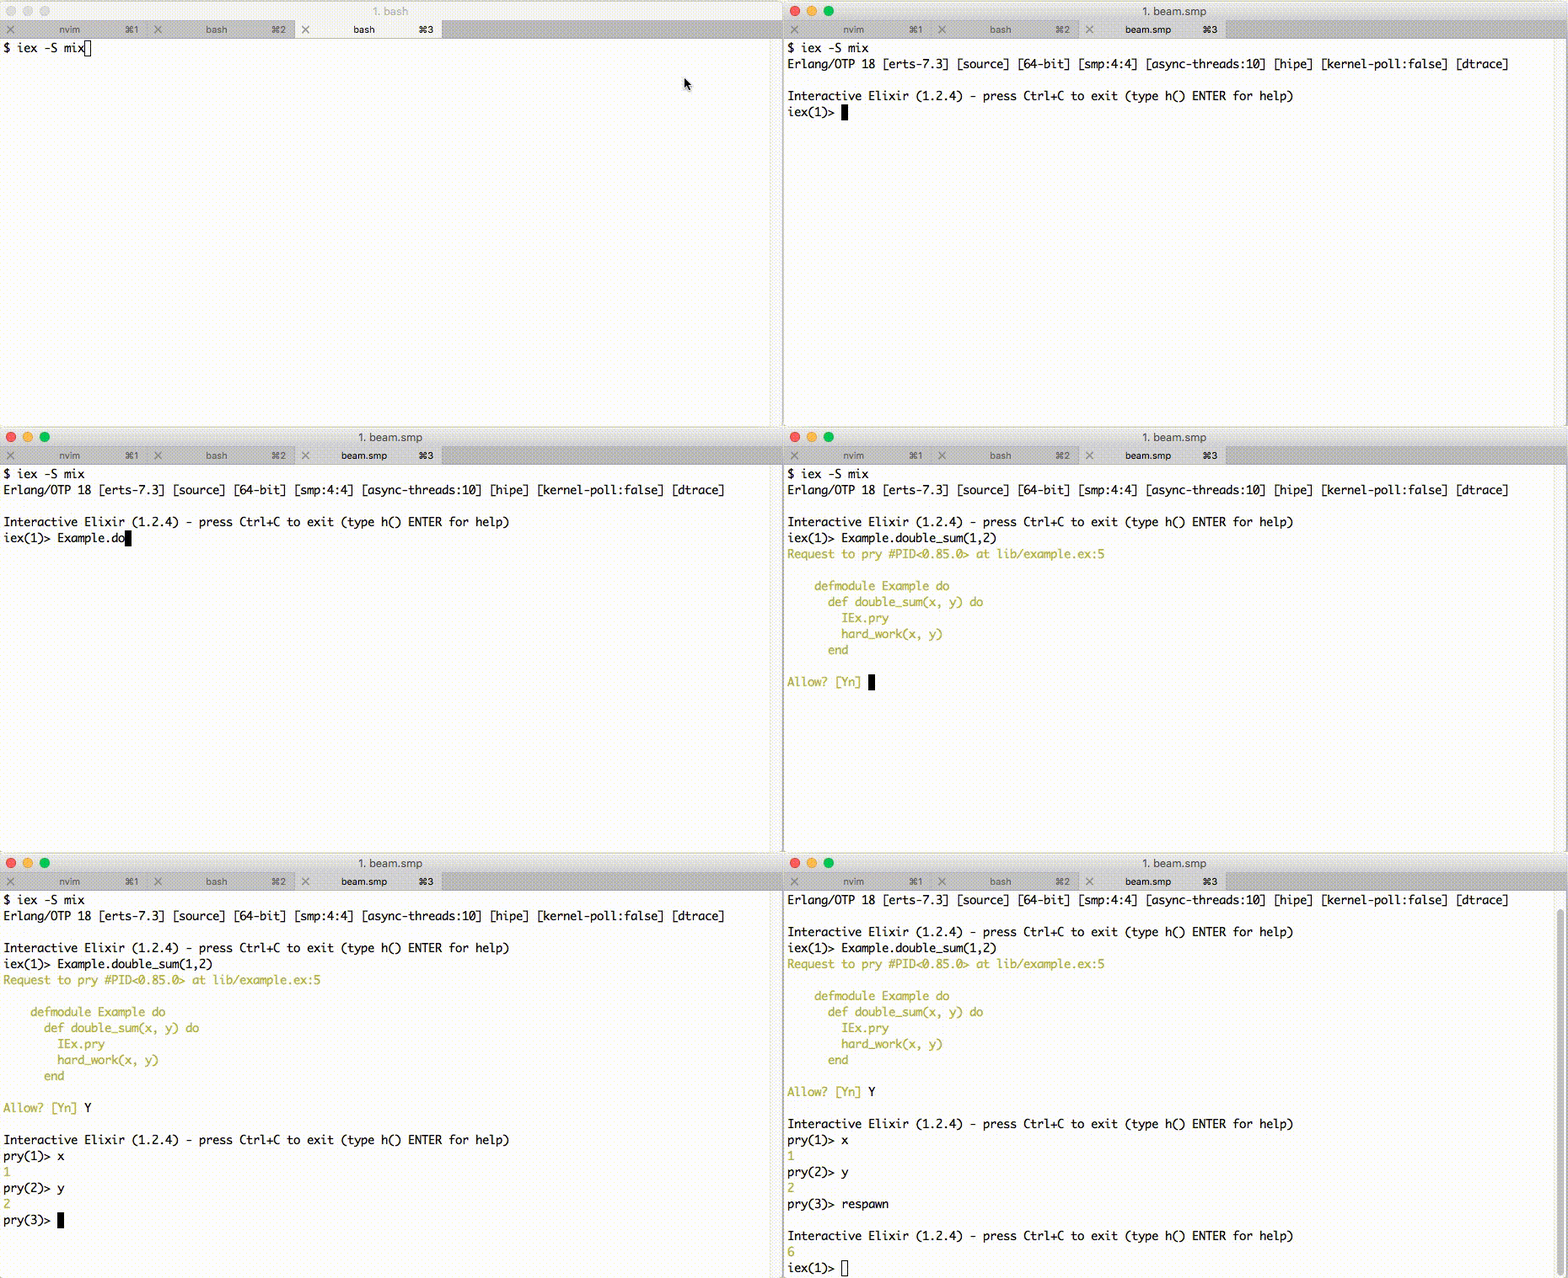
IEx.pry/0 is built on top of IEx. Although it isn’t a traditional debugger since you can’t step, add breakpoints and so forth, it’s a good tool for non-production debugging. It runs in the caller process, blocking the caller and allowing us to access its binding (variables), verify its lexical information and access the process information. You can finish your “pry” session by calling respawn, which starts a new IEx shell.

You can find more information at IEx.pry doc.
Debugger
If you need a breakpoint feature, we can use the :debugger module that ships with Erlang. Let’s make a change in our example to be more didactic:
defmodule Example do
  def double_sum(x, y) do
    hard_work(x, y)
  end

  defp hard_work(x, y) do
    x = 2 * x
    y = 2 * y

    x + y
  end
end
Now we can start our debugger:
$ iex -S mix
Erlang/OTP 18 [erts-7.3] [source] [64-bit] [smp:4:4] [async-threads:10] [hipe] [kernel-poll:false] [dtrace]

Compiled lib/example.ex
Interactive Elixir (1.2.4) - press Ctrl+C to exit (type h() ENTER for help)
iex(1)> :debugger.start()
{:ok, #PID<0.87.0>}
iex(2)> :int.ni(Example)
{:module, Example}
iex(3)> :int.break(Example, 3)
:ok
iex(4)> Example.double_sum(1,2)
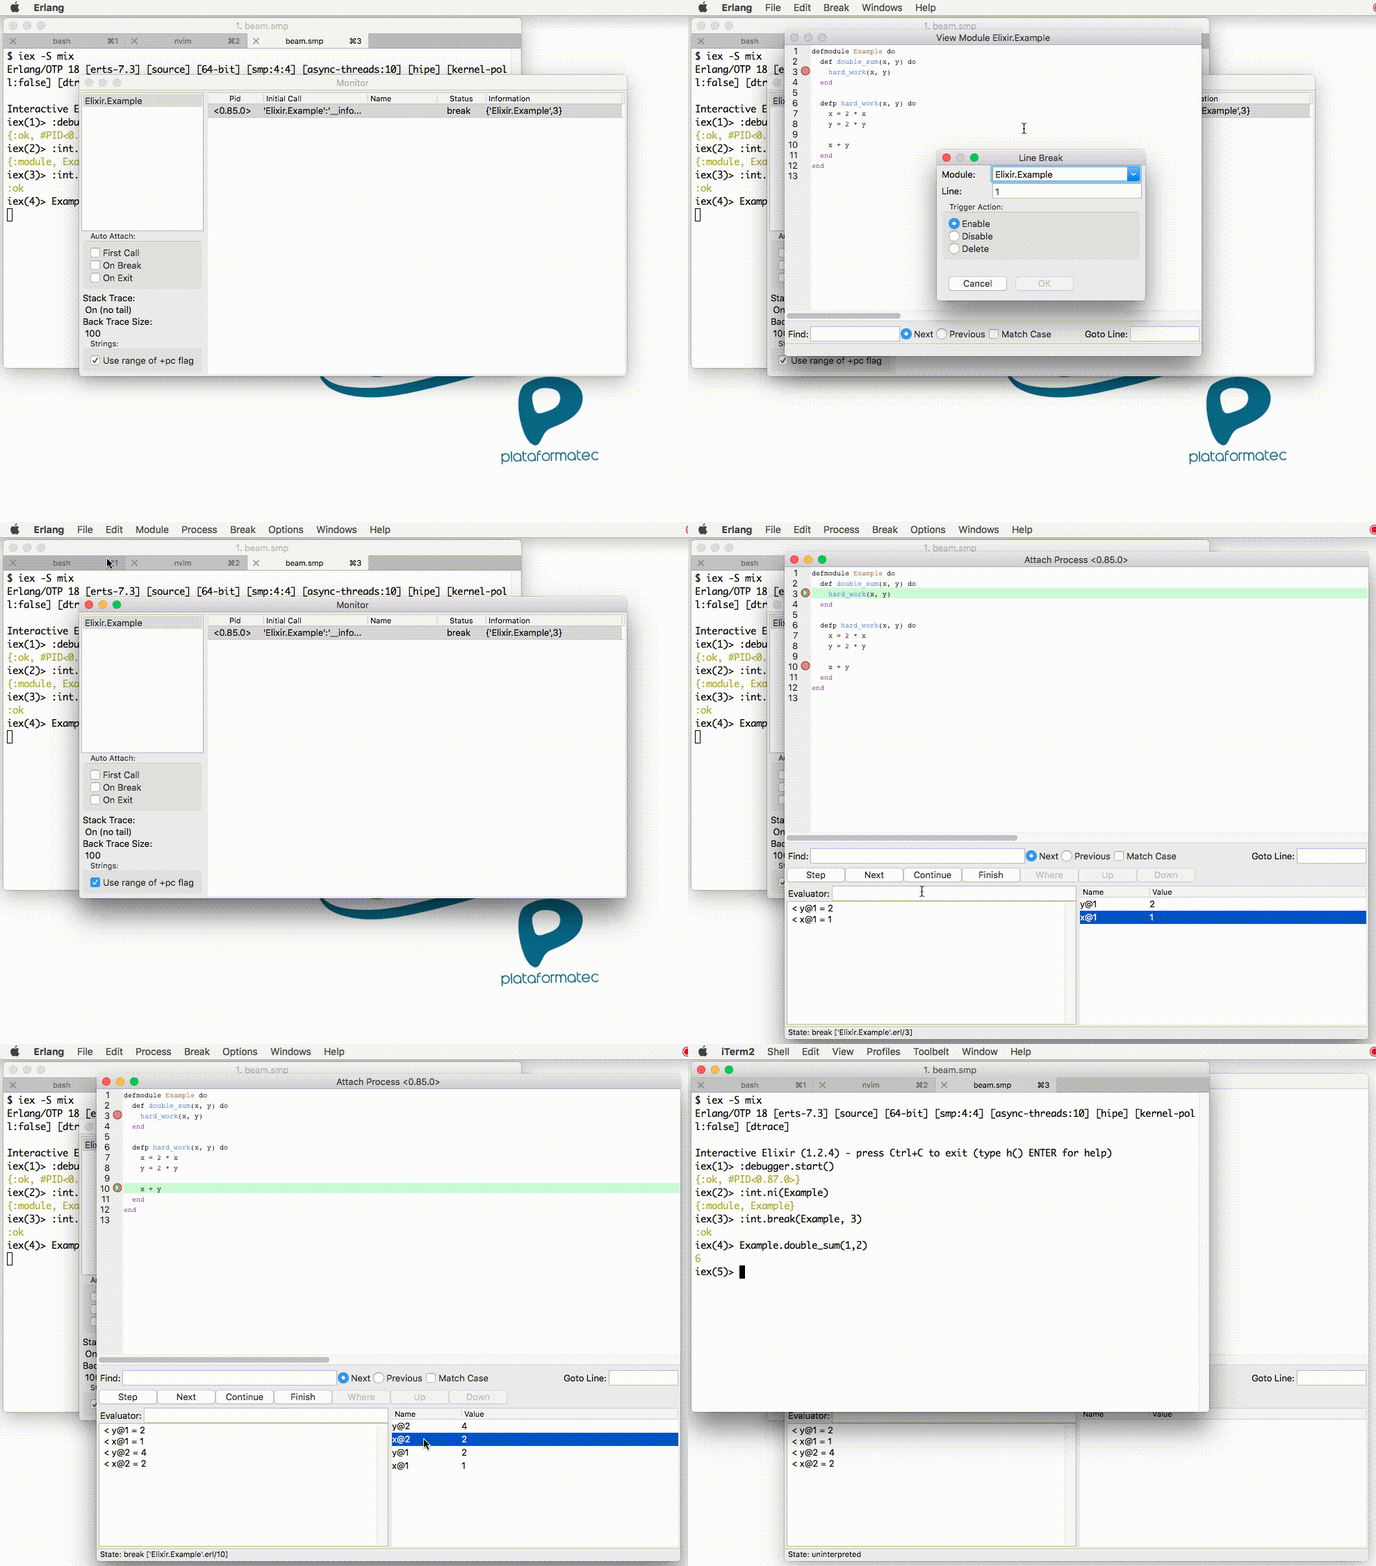
When you started the debugger, a Graphical User Interface must have opened in your machine. We called :int.ni(Example) to prepare our module for debugging and then added a breakpoint to line 3 with :int.break(Example, 3). After we call our function, we can see our process with break status in the debugger:

The process is blocked as in IEx.pry/0. We can add a new breakpoint in the monitor window, inspect the code, see the variables and navigate it in steps.
Debugger has more options and command instructions that you can use. Take a look at Debbuger doc for more information.
Troubleshooting
You may have some problems when executing :int.ni(Example) in the example above:
iex(2)> :int.ni(Example)
** Invalid beam file or no abstract code: 'Elixir.Example'
Before the upcoming Erlang 19 version, the debugger did not have the heuristic that traverses the module source attribute applied. If you are not on the latest Erlang version, you can update the debugger manually with the following steps:
- Download the file
int.erlfrom the PR. - Compile it with
erlc -o . int.erl. - Overwrite
lib/debugger/ebin/int.beamin your Erlang installation with the new compiled file.
In the next post, we will see a tracing technique that doesn’t block the caller process.
What about you? What are the tools that you are using to debug your Elixir applications?

Thanks Erich, this is very useful information!
“Download the file int.erl from the PR.”
Would be nice to have a link; whether to the file or the PR I don’t really care…
The PR is linked in the post. In case you missed it, here it goes again:
PR: https://github.com/erlang/otp/pull/977
File: https://github.com/josevalim/otp/blob/c7e82c6b406b632a191c791a1bd2162bde08f692/lib/debugger/src/int.erl
I’m a big docker fan for dev. Does anybody know if you can get the debugger to work with docker?
Great article.
I got it working on Windows with the int.erl compile and the –werl. I tried debugging a Phoenix app and it worked but I don’t quit know what I am doing. To debug the Phoenix app:
c:devhello_phoenix> iex –werl -S mix phoenix.server
iex(1)> :debugger.start()
iex(2)> :int.ni(HelloPhoenix.PageController)
iex(3)> :int.break(HelloPhoenix.PageController, 5)
Refresh browser and it breaks at the controller. The “:int.ni” interprets the module for debugging purposes. Does this mean that I need to call ni and break for every module I want to step through – I guess so. Do you know if it is possible “Step over” – I can’t see any difference between “Next” and “Step” in the debugger. Am I doing it right?
I had no idea this was possible with elixir/phoenix so it’s great for tracking down elusive issues.
I’ve written a convenience script to make patching the beam file easier (tested on OS-X)- you can grab it from here : https://gist.github.com/ef1830f3f7ce2fcdbda2cf9aa781b68f
HI Scott, you can use debugger with docker.
Probably, the debugger will not run in the docker. So, my suggestion is to start a locally shell and connect with your node in docker and then use the debugger. Our next post will cover this strategy. Stay tuned for more details.
THANKS!!! I figured it was possible. Just wanted to see if there was any advice on the subject. Thanks, I’ll take a stab at it over the weekend.
How do you evaluate expressions in the evaluator window after attaching to the process? I have variable names listed like `resource@1`, but that’s not a valid Erlang variable name, so I can’t do `resource@1#{relationships}` to get the `relationships` value out of the `resource@1` map. I seem to only be able to evaluate variables by clicking on their name. Is there someway to refer to Elixir variables, so the Erlang evaluator can parse them?