At Plataformatec, we are always learning new techniques to help our clients introspect and monitor their production systems. Last week, we saw debugging techniques in Elixir and now we will see one of many ways to do tracing in Elixir.
For this post, we will use erlyberly. You can see the installation instructions in its README.
Tracing gives you all the data you need and doesn’t block your process as debuggers. It’s indicated for production and development.
Naming nodes
After you start erlyberly with java -jar target/erlyberly-<version>-runnable.jar, you need two pieces of information from your application to connect: the target node and its cookie.
The target node is how you will identify the node that you want to connect to. You need to start your process with the option --name or --sname (short name).
$ iex --name "foo@127.0.0.1" -S mix
Erlang/OTP 18 [erts-7.3] [source] [64-bit] [smp:4:4] [async-threads:10] [hipe] [kernel-poll:false] [dtrace]

Interactive Elixir (1.2.4) - press Ctrl+C to exit (type h() ENTER for help)
iex(foo@127.0.0.1)1> node
:"foo@127.0.0.1"
The cookie provides authentication for connecting nodes. When you start a node with a name, you will receive a cookie that is created randomly the first time and reused in the next ones. You can check the cookies in IEx with Node.get_cookie/0 or in the file ~/.erlang.cookie.
You can start a new node with a different cookie too:
$ iex --name "foo@127.0.0.1" --cookie "my_cookie" -S mix
Erlang/OTP 18 [erts-7.3] [source] [64-bit] [smp:4:4] [async-threads:10] [hipe] [kernel-poll:false] [dtrace]

Interactive Elixir (1.2.4) - press Ctrl+C to exit (type h() ENTER for help)
iex(foo@127.0.0.1)1> Node.get_cookie
:my_cookie
The target and cookie are used to connect remotely to your node. Similar to when we use the User Switch command inside the IEx shell or via the option --remsh when starting IEx.
Erlyberly usage
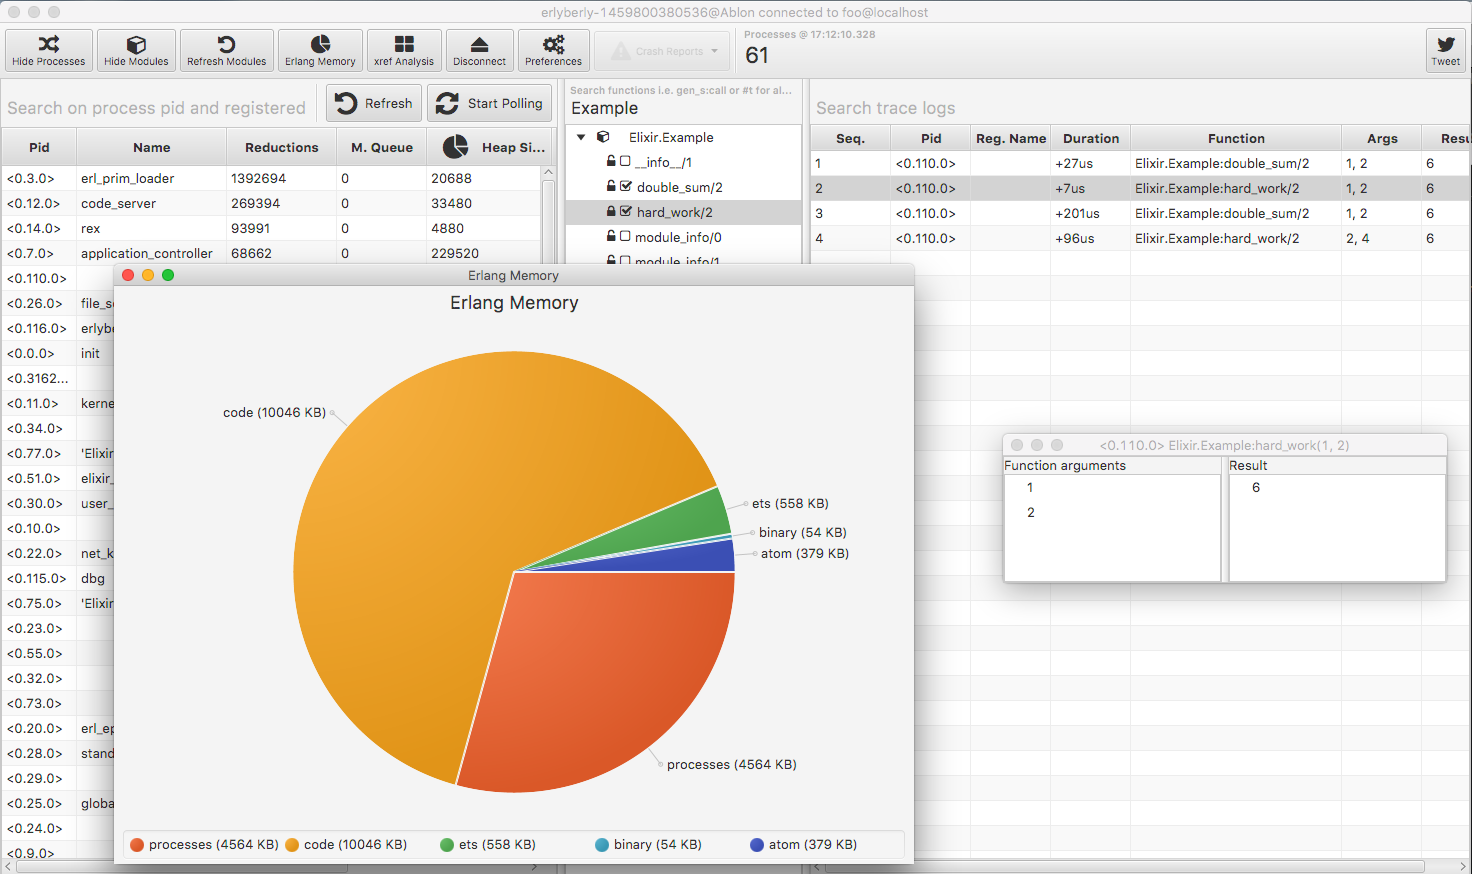
Now we are connected to our application. We have 3 panels: processes, modules and trace log. Furthermore, we can see the Erlang memory and the crash dumps.
Processes
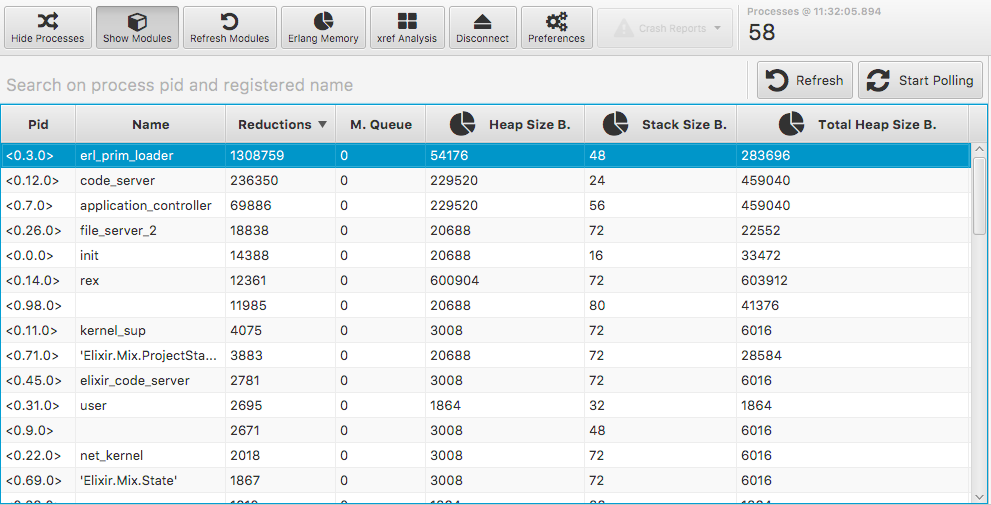
In the processes area, you can check a snapshot or start polling your application. We have a lot of information about our processes such as their PID, reductions, message queue and head/stack size.
With the message queue, we can avoid the most common cause of failure: out of memory in the node. This is usually related to message queues when a process receives messages at a faster pace than it can handle.
The CPU is harder to profile. Some examples that we can point out: scheduling and busy looping to ensure the lowest latency. The VM internally uses a model based on reductions (work actions). Every function call will increment the reduction counter for its current process. The process is descheduled after a given number of reductions. We can access this information in the processes area.
Memory
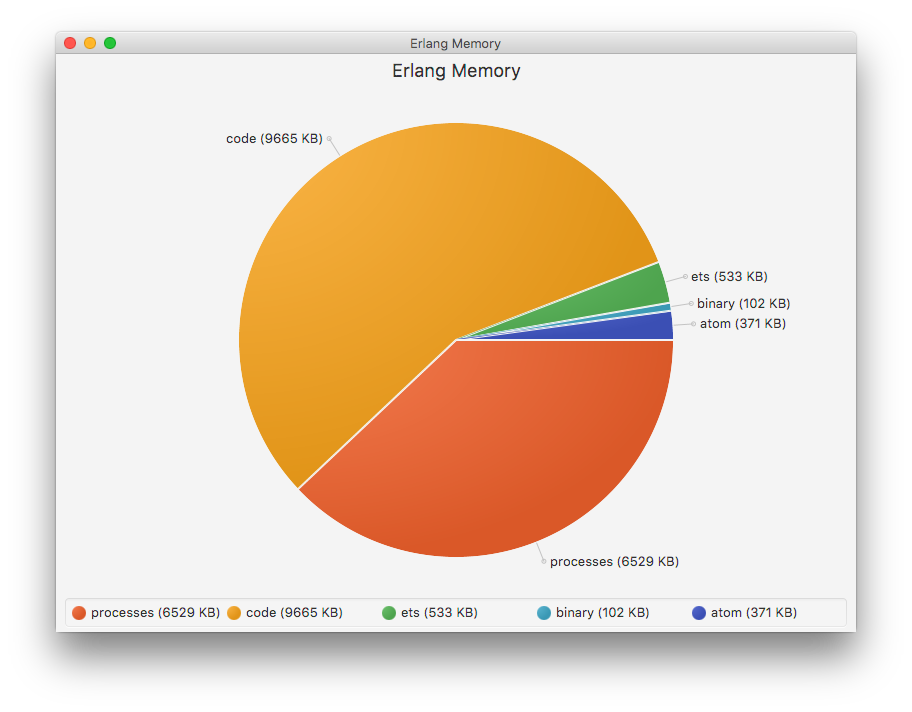
The memory graph is based on :erlang.memory(). The data is the memory actively used by Erlang VM, not the memory set aside by the OS. You can find information about the processes (stacks and heaps from Erlang), ETS tables, atoms in the VM and the binaries.
Modules and traces
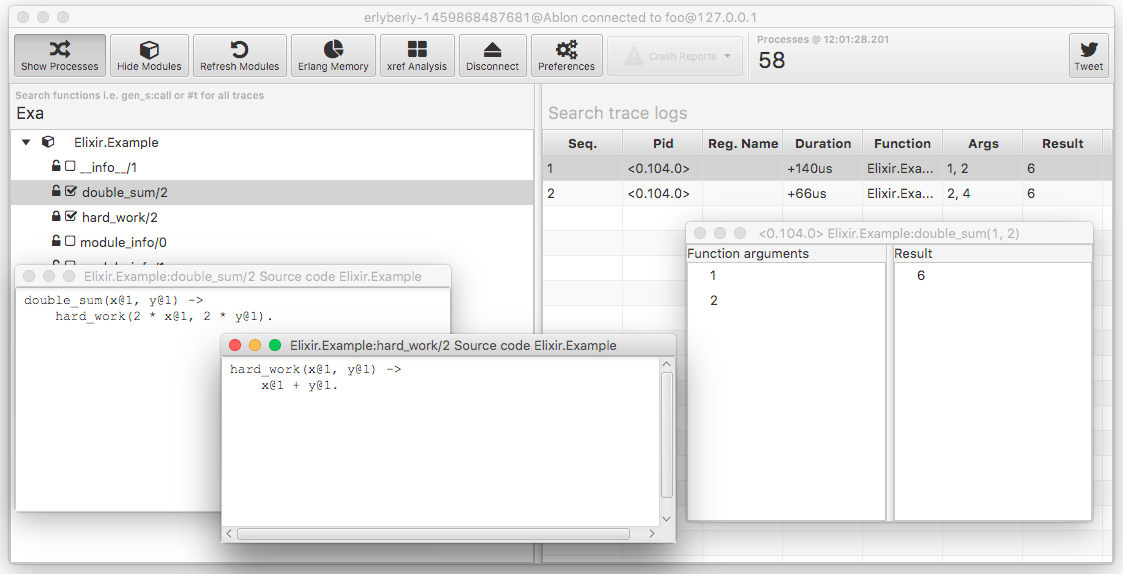
In the modules area, you can filter your modules and check which functions you want to trace and see their source code. In the trace logs, you can check your function calls with breakdown of their arguments and their results.
You can check for exceptions, incomplete calls, process states and so on. You can find more information in the erlyberly project.
This is one more visual tool for tracing your application. Other options are redbug, recon_trace, dbg and more. Which tools and techniques do you use to introspect your production apps?