
Frequently I hear speculations about story points and their relation with the development time. Questions like: “Why a 3 points card took so much time to be developed” “How long it takes to deliver an 8 points card?”, “Why the team took so long to deliver only this amount of points?” and others are frequent. However, when searching about story points and development time, there is a series of comments about this relationship where: some people will tell you story points measure only the effort to implement a card, others consider a relation between days (or even hours) and the points, while others only compare sizes between the cards and so on.
Trying to get a better understanding of this subject to talk to clients and stakeholders in general, I decided to collect real project data and analyze the relation between amount of story points of the cards and the time it took for each to be developed, counting since the time they started to be developed until the moment they are delivered to production, the famous Lead Time.
Disclaimers
Before we start, some disclaimers about the context of the project:
- Right in the first few weeks of the project we already had the first big problem with story points: subjectivity in estimate the cards. Why this card is worth 3? How do I know this card is twice or thrice the size of the X card? What do I consider in this estimative?
- Thus, it was suggested to the team to utilize some criteria to estimate, intending to reduce this subjectivity.
- My friend and colleague Henrique Oliveira suggested a Fibonacci-like matrix, taking into account T-Shirt Size estimates, to estimate the cards, that helped the team a lot. Check it below:
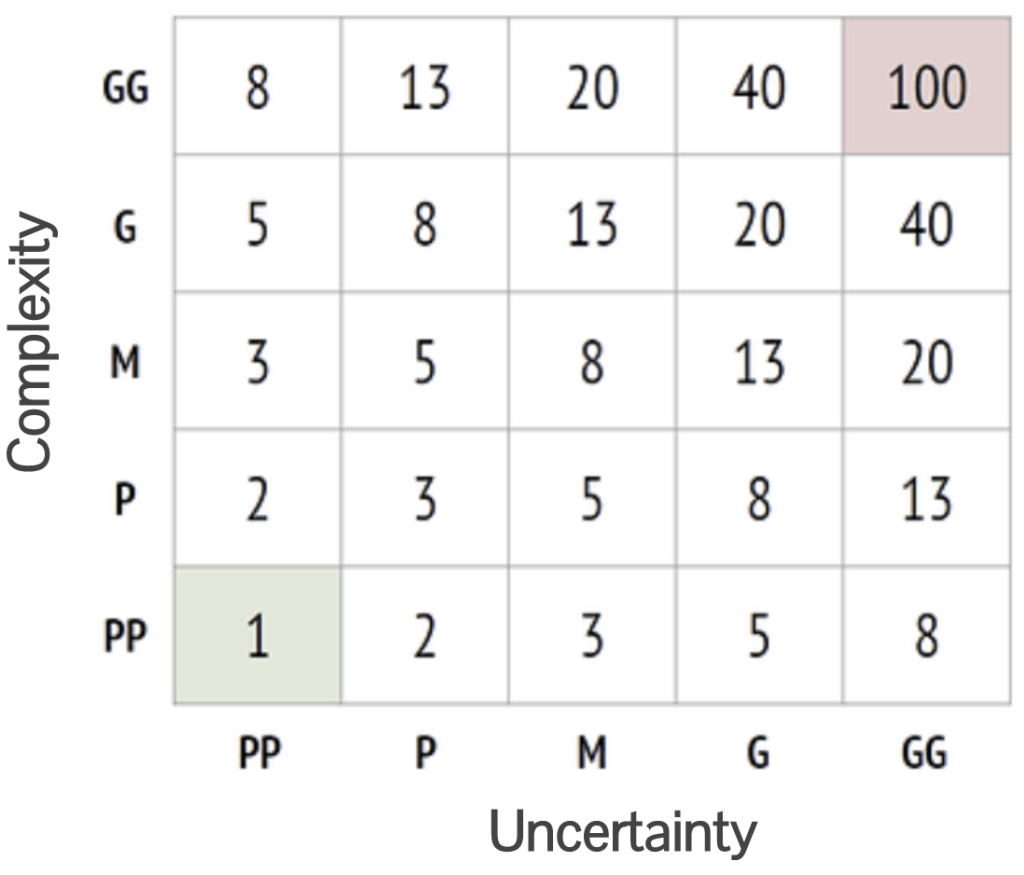
- Cards estimated as 13 points or higher were broken into smaller cards, as the only time we worked with a card with 13 points, it exceeded the timebox of the sprint, which was 10 business days. So we decide to do not let any card with 13 or more story points to be added to the sprint backlog.
- Cards were broken down into smaller cards in a way that they delivered something functional in production, so that the backend and frontend stayed together on the same card.
A look into the data
I began by collecting the data of the project as a whole and analyzing the lead time graph with all cards that had already been finished or that were in production.
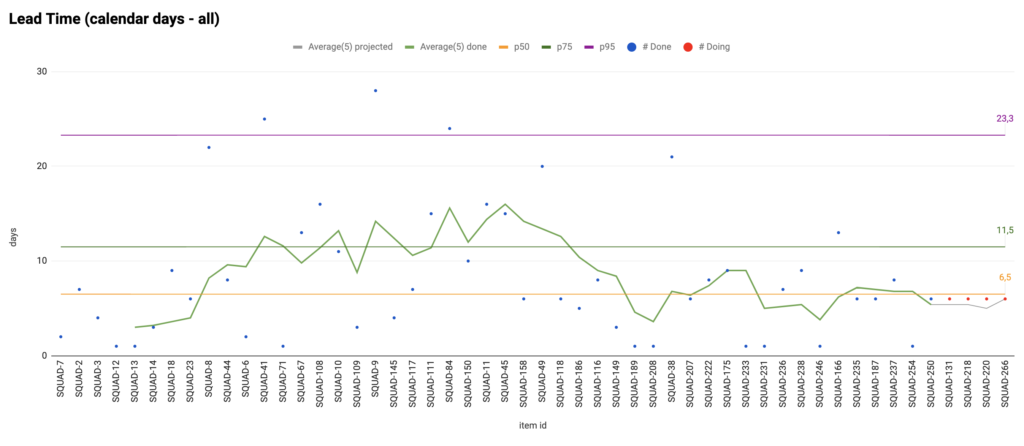
After acquiring this data, I segmented them by the amount of story points and analyzed them individually, having the following graphs:
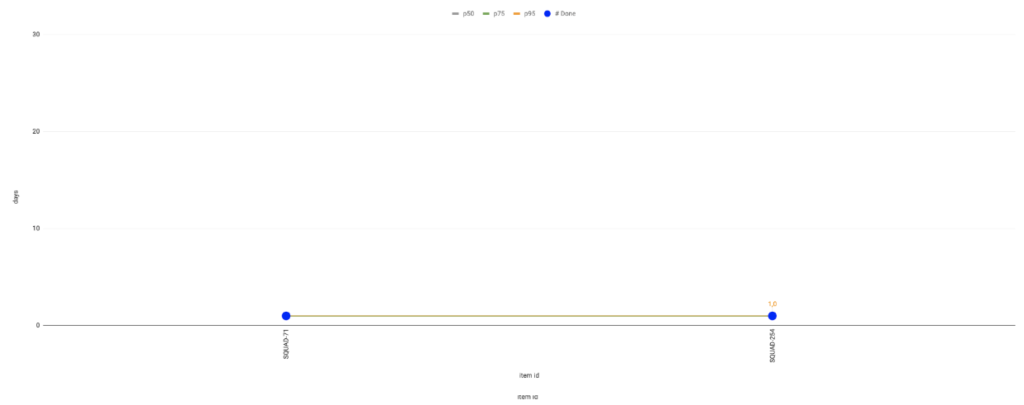
Cards with 1 story point
Cards with 2 story points
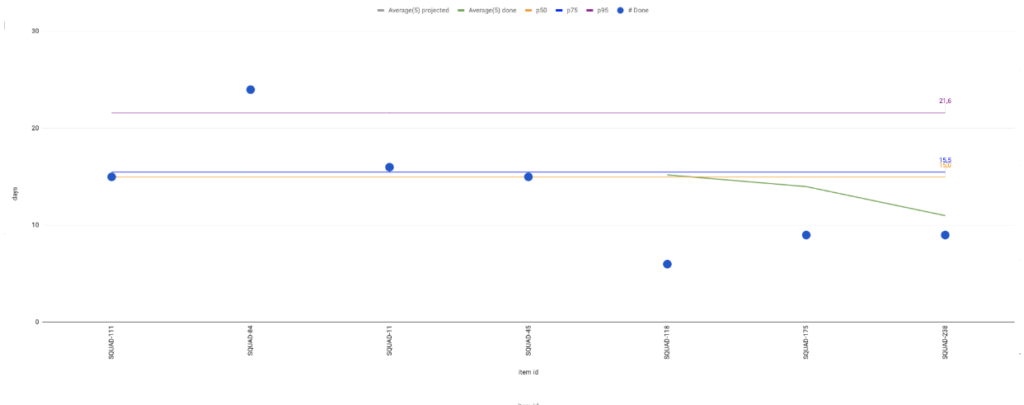
Cards with 3 story points
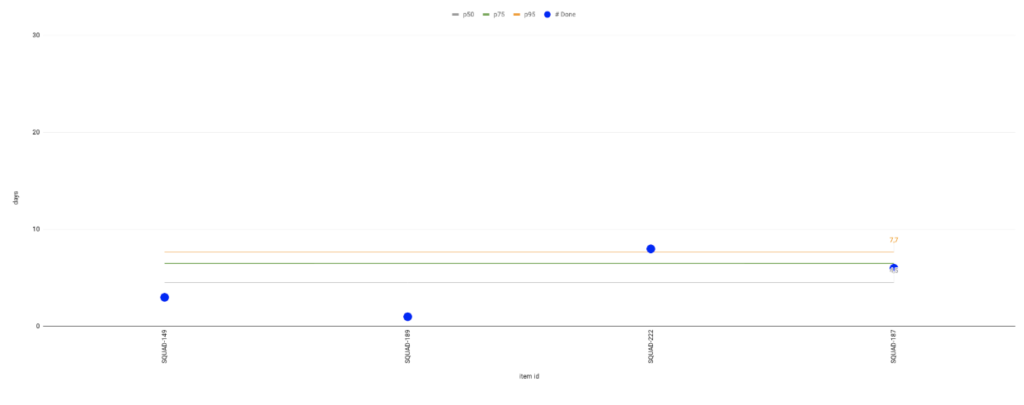
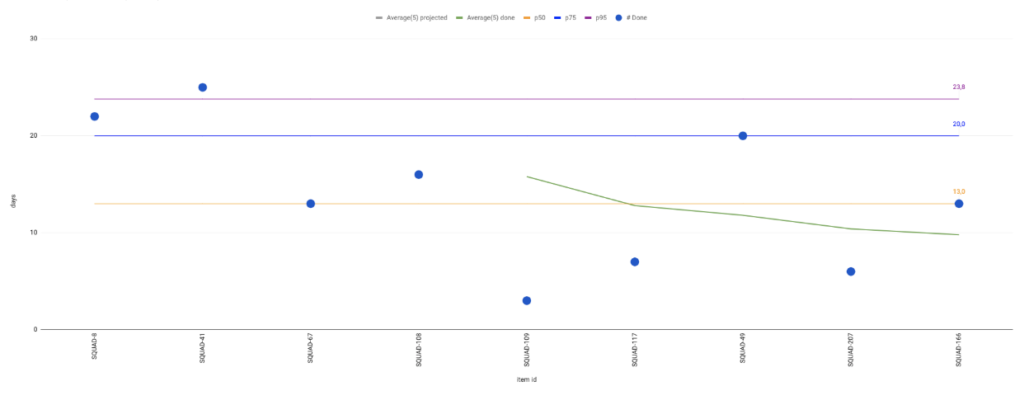
Cards with 5 story points
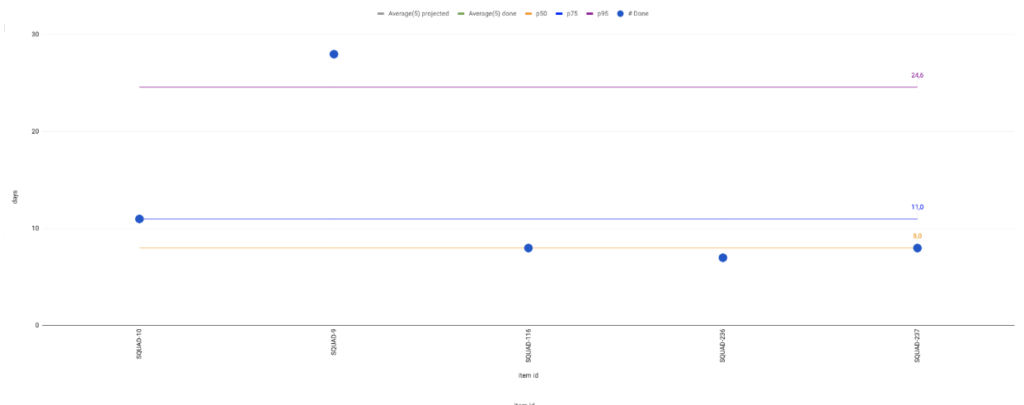
Cards with 8 story points
Cards with 13 story points

Data Analysis
After analyzing the data, I reached some conclusions:
- It’s possible to verify that cards worthing 3, 5 or 8 points have a development time (lead time) similar, not being possible to find a correlation between time and the number of story points (it is not scalar).
- If we take a category with plenty of samples, like the cards with 5 points, it’s evident they differ a lot, not being possible to make some affirmations such as “a card worth 5 points takes between X and Y days to finish” when X and Y a small interval of days (1 to 3 days). The same happens with cards with 3 and 8 points.
Observation: Data referring to cards worth 1, 2 or 13 story points were excluded from the individual analysis, because there was little data to be analyzed individually.
Other Analysis beyond story points x lead time
I reached more conclusions about the use of story points that I would like to share with you all:
- At the beginning of the project, when we started to use story points, the subjectivity was very high. By establishing some criteria for estimation, we were able to stabilize it, making the time of development vary a lot less, increasing predictability. If you want to develop this with your team, consider checking out this article from Mike Cohn.
- With the addition of more scoring criteria, like test complexity, dependency on people that are not in the team (internal or external to the company), risks related to the cards and more, we lowered the lead time variability and increased the card delivery rate by breaking the card into smaller ones.
- Many times people relate story points with only the development effort, and this makes the team consider only the time of the Execution of a task. Another point is that the testers/QAs and UXs/designers, have little to no involvement in the estimatives. Making the team think not only about development, but also about the duration of the process as a whole (considering the steps of code review, tests, deploy, etc) and inviting more people to share their concerns about the estimatives helps to improve the predictability of the team.
- With help from metrics like lead time breakdown and CFD, the process of stabilizing the scoring was much easier, as it made the team think about the whole process and showed in which step of the process the team was spending the most time with.
Conclusions
The major conclusions I had were:
- It wasn’t possible to relate time of development (lead time) with Story Points directly, as the goal of the study was.
- It is important to say Story Points should be used inside the team level. If you want to know more about this subject, I recommend the reading of this text from Troy Magennis.
- It was possible to increase the predictability of team delivery and stabilize the process of development using story points with other tools at the same time.
- There are indications that, when you add more criteria to the estimation to breakdown the cards into smaller cards, the smaller the risk/effort/complexity will be and, consequently, the predictability you also increase.
- An important point here is that story points and other estimative methods consider only the moments in which a demand is being worked on, and not consider/can’t predict the time that a demand will be staying in waiting to be worked on. Basically, the team considers how long it will take for a demand to be developed and tested, but don’t consider in this estimatives (as it is not possible to predict some points in the middle of the development) how long the demand will be staying in waiting to be tested, to be deployed or how long it will take to resolve a hypothetical impediment. In other words, the process efficiency will impact your lead time, and consequently, the relation between story points with the time of development. This way, it’s plausible that a user story of 1 story point takes the same amount of days that a 13 points user story to be delivered, because of the flow efficiency. If you would like to know more about process efficiency, check this article.
And if you were asked if you would use story points to estimate a deadline for a delivery of a project or card, what would you respond?
I would say that story points, like the matrix for complexity and uncertainty (T-shirt Size), are excellent tools to instigate your team in better breaking user stories down and help with improvements in the processes, however, to estimate deadlines, I prefer to utilize process metrics and other tools, like a Monte Carlo simulation to help predict when a set of cards will be delivered.
What about you? Do you have any experience with Story Points and time estimates? Have you passed through any similar scenario? What’s your opinion about what I shared in this text? Share with us commenting below or in this email contagil@plataformatec.com.br