As you may have noticed, we took advantage of the new Elixir Radar channel development to run some project management experiments, so we could improve our methods and toolset. Some of those can be found in these blog posts:
- Forecasting software project’s completion date through Monte Carlo Simulation
- Lead Time Experiment: Calculating Lead Time of the whole process
- Case Study of a WIP Limit Implementation: Why, When and How to use WIP Limits
Another experiment that we did was to analyze the metrics that we generally use, however, instead of tracking them on a weekly basis, doing it daily. The project was supposed to be very short and weekly metrics would have shown us the problems when it was already too late to act. The intention here was to see if with a shorter feedback cycle, the metrics would make us notice problems faster: like bottlenecks, queues etc.
If you are not aware of the metrics we use, here are some blog posts about them:
- Why we love metrics? Cumulative flow diagrams
- Why we love metrics? Throughput and Burnup charts
- Why we love metrics? Learning with Lead time
We will present next our opinion on the effectiveness of using each one of those metrics on a daily basis.
Cumulative Flow Diagram (CFD)
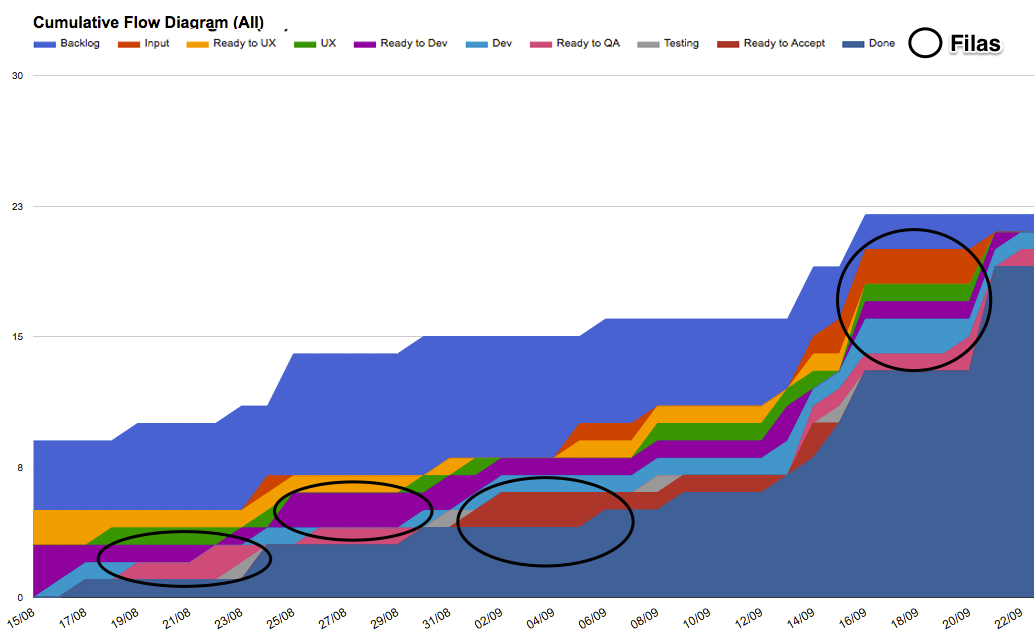
The daily CFD was the most used daily metric for us. In the first weeks, it was too difficult to find bottlenecks only by seeing the weekly metrics. But as you can see on our daily CFD chart, we spotted some queue growth throughout our project and could act on them on a daily basis to avoid losses.
Burnup chart
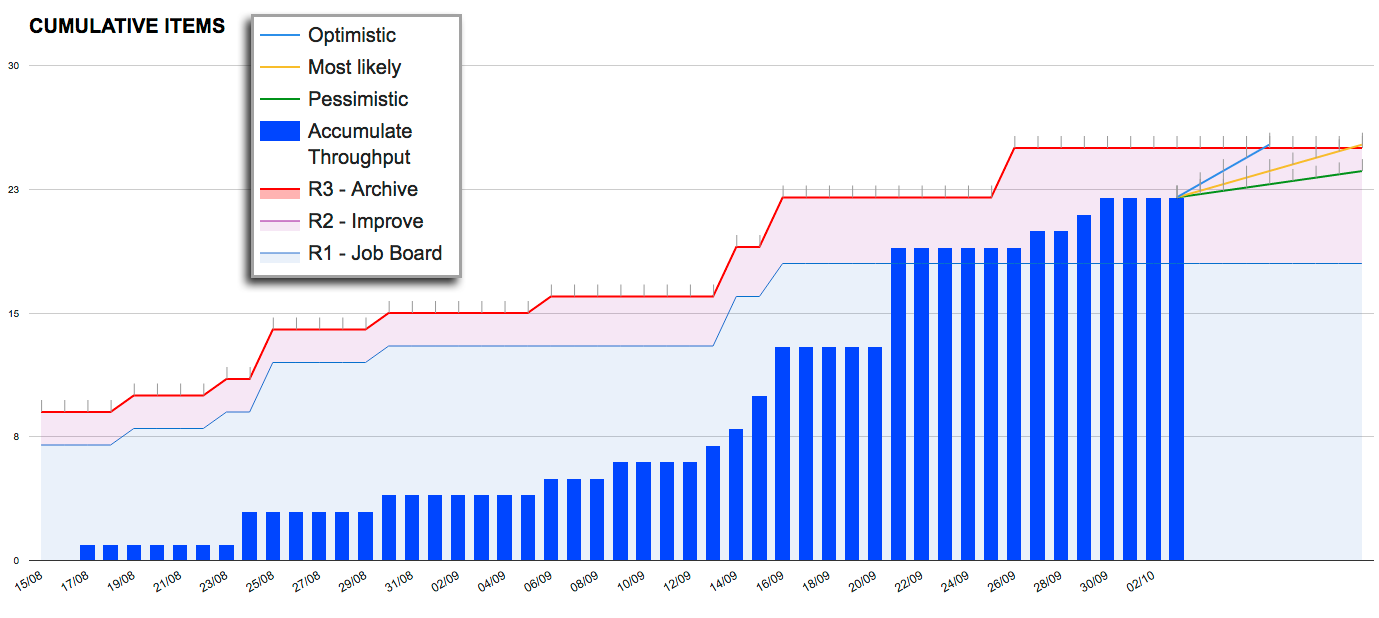
We didn’t use much the daily burnup chart, but we believe that it can be very helpful in case your client and/or product owner want faster feedbacks on how the project health is.
It is possible to see that the backlog changed on a daily basis in the beginning of the project, that information could help the stakeholders take faster actions to mitigate possible delays.
Throughput and Predictions
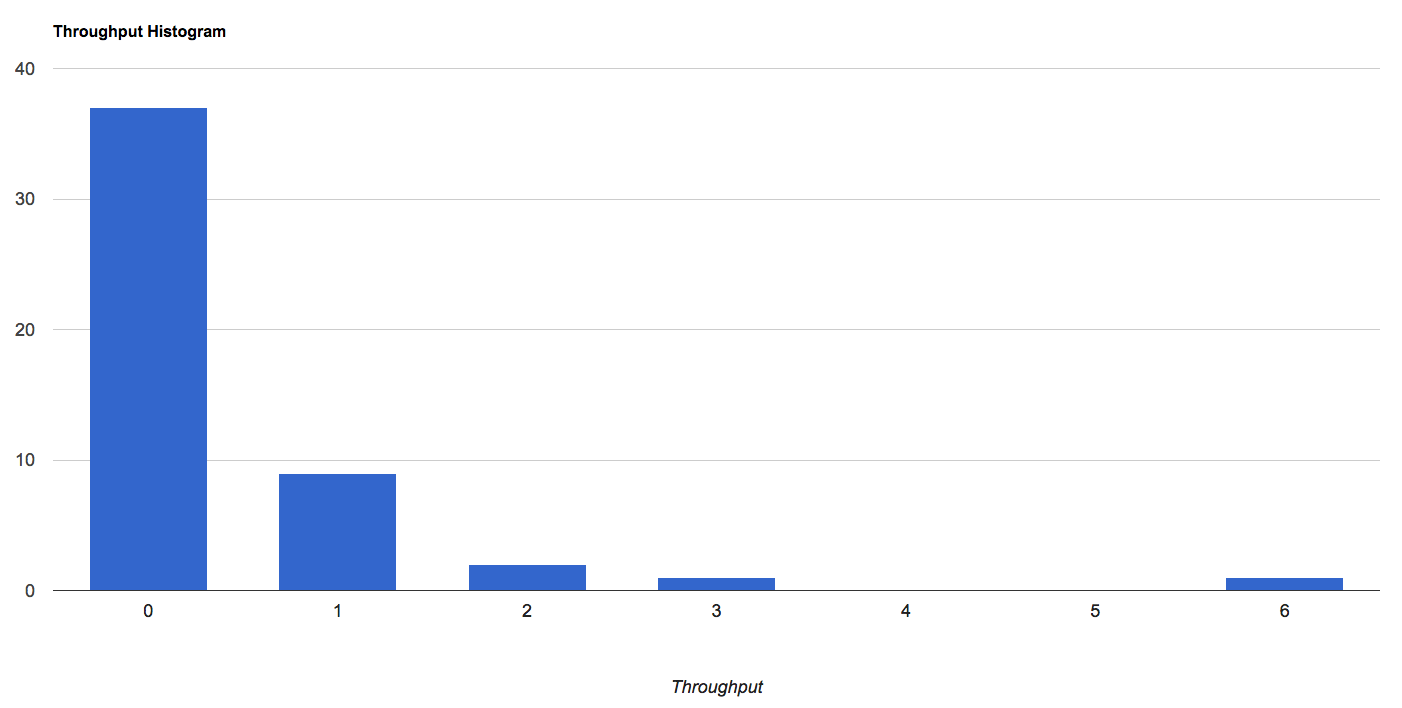
Our Monte Carlo simulation didn’t work well with “daily throughputs”, that are actually the number of deployed stories per day. That happened because, if you remember how we use Monte Carlo from our blog post Forecasting software project’s completion date through Monte Carlo Simulation, we base our simulation on our throughput history. Moreover, if you see our throughput histogram, you’ll be able to notice that on most of the days there weren’t deploys, which means that the simulation would be extremely pessimistic and skewed to zero.
Conclusion
At the beginning of projects, we usually feel we don’t have enough data to make decisions, but if you start gathering data on a daily basis you might have enough information to perform fast changes on your process and guarantee an even better cadence to your deliveries.
At the end of the project, after we already had enough weekly input, we abandoned the idea of a daily metric. We did that because with the progress of the project, the daily data became more noisy than helpful, and the weekly data was already reliable enough. Therefore, this approach seems to work best at the beginning of a project.
What do you think of daily metrics? Would you use them? Leave your comments below! 🙂