As you might have noticed, we have been testing new methodologies on our projects in order to improve them and be more agile. We started using Monte Carlo Simulation (Forecasting software project’s completion date through Monte Carlo Simulation), limiting the WIP of our process (Case Study of a WIP Limit Implementation: Why, When and How to use WIP Limits) and now we would like to open a discussion on lead time boundaries – in which step of our process to start and end lead time (LT) measurement.
We, at Plataformatec, used to measure LT by calculating the time that a story would take to move from a “Developing” column until the end, usually the “Done” column, which means that the story is in production. However, a past project made us question that definition.
We had a project in which the bottleneck of the process was before the developing process: the UX designing phase. We couldn’t see it in numbers, because it was not being measured. The only way it was possible to spot it was based on the team’s feelings. After the successful end of the project, we had an internal retrospective ceremony in which we’ve stated that if we had concrete information on the UX phase, we would be able to act on it earlier.
One of the alternatives that we found, would be to measure the LT of the whole process, from “Input” to “Done”. And that is what we did in our latest project, the new Elixir Radar channel project, and we would like to share our insights on it.
The Experiment
The project had the following Kanban board at the beginning:

We defined our LT as the time a story would take to go from “Refining” until “Done”. We chose “Refining” instead of “Input” because at that moment, we would only start working on a story from “Refining” on.
However, we saw that we still could not answer a question: “What are the next X stories that you want to be done in Y weeks?”. To do that we would need to limit the WIP of the “Input” column and start measuring the LT starting at that same column. So, as we explained in our wip-limit blog post, we limited the “Input” WIP, we cut off the “Refining” column, since a card would stay on it only for a few minutes (in our team a refining meeting had a very low cost to be done), and we started calculating the LT from “Input”.

Results
One of the results that we got from those changes was the fact that now we could inform the client (or the Product Owner) how much time it would take us to deliver something that he asked for. We believe that information is what really matters to him/her. Measuring from “Developing” to “Done” would not satisfy the P.O.’s question, because a lot of work is done before a feature is ready for development.
This little change in the measuring process also gave us extra information on the Lead Time Breakdown chart. As we could now see the amount of time spent in early stages of the process, we could also limit the WIP in columns like “Ready to UX” and “Ready to Dev”, which has lessened the time spent on those columns and reduced the total LT.
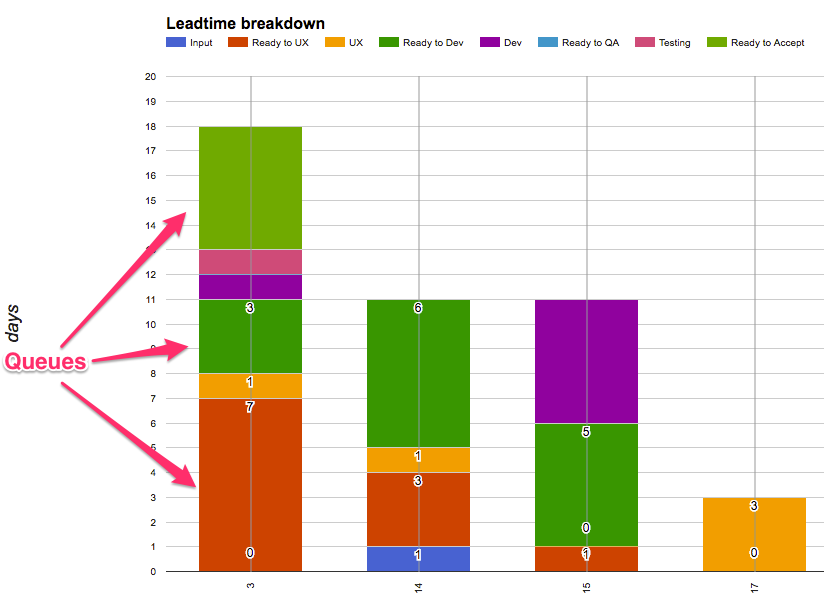
This extra information also helps the communication with high-level stakeholders that want to know where the time is being spent in your project.
We also noticed that extending the LT to all the parts of the process reinforced the image that everyone is working together on the project. That made the PO and UX designer of the project get much closer to the rest of the team.
On the other hand, it is important to say that measuring earlier stages of the process may scare the team at first, because the LT values will grow. The industry is used to have the feeling of productivity related to developing, testing and deploying cycle.
Therefore, we think that instead of making a complete transition from a developing-to-end LT to a whole-process LT, one should actually maintain both metrics at the same time. With both, you can still control your development team improvements (with all the historical data that you already have) and start monitoring the rest of the process.
We also had an insight that it may also make sense to calculate the LT of sub processes that make up a work system. For example, one could possibly calculate an UX LT by measuring the amount of time that a story spends to go through all stages related to UX. But that’s a subject for another blog post…
What about you? How do you measure lead time? Did you like our approach? Tell us what you think in the comments below.